QR Codes
QR Code Scan Analytics: What You Can Measure and How to Read It
How to measure how often a QR code is scanned, which data is meaningful, where measurement reaches its limits and how to use the results in your campaigns.
When you put a QR code on a brochure, a poster or product packaging, what you really want to know is whether people actually scan it. Scan statistics answer that question and turn printed material into a measurable channel. But not every statistic is equally meaningful, and QR measurement has some natural limits. This guide explains how QR code scans are measured, what each metric tells you and how to turn the data into decisions.
How are QR code scans measured?
Measurement depends on the type of code:
- Static QR codes carry the content directly. When a phone reads the code, it opens the web address, text or Wi-Fi details without any intermediary. Because no server sits in between, scans cannot be counted.
- Dynamic QR codes carry a short redirect link. Every time the code is scanned, the request first reaches that link's server; the server records the scan and sends the visitor on to the content. This means every scan can be measured.
So every code you want to measure must be dynamic. We cover the other differences between the two types in our guide to static vs dynamic QR codes.
Which data is meaningful?
| Metric | What it tells you | How to use it |
|---|---|---|
| Total scans | How many times the code has been scanned since it was created | Overall level of interest |
| Last 30 days / last 7 days | The recent trend | Whether the campaign is still alive |
| Today | Activity right now | Tracking an event or launch day |
| Daily scan chart | Change over time | Linking peaks to what happened on a given date |
| Breakdown by weekday | Which days are busiest | Staff planning, timing of posts |
| Device type (mobile, tablet, desktop) | Which device the code was opened on | Which screen to optimise the landing page for |
| Most scanned codes | Comparison between codes | Which material and which location works best |
What scan counts don't show
To read statistics correctly you need to know the limits of measurement:
- A scan is not a unique person. If the same person scans the code three times, that counts as three scans. Don't read the total as "how many people we reached".
- A scan is not a conversion. The scan count alone does not tell you whether the person bought something or filled in a form. For that you need to measure actions on the page that opens separately (for example, the number of survey responses).
- Shared links can be counted too. If the dynamic code's link is copied and shared via WhatsApp or email, opens from that link are also added to the scans. This is usually desirable, but assuming "every count is a physical scan" would be wrong.
- Static codes show zero. If a static code's statistics always show zero, it doesn't mean nobody scanned it; it only means it cannot be measured.
Setting up measurement correctly in campaigns
The most common mistake is using a single code everywhere and then trying to work out which channel performed. To actually learn something from measurement:
- Create a separate code for each channel or location. Use different codes for the shop window, the brochure and the trade show stand, even if they all lead to the same page.
- Give codes descriptive names. Names such as "Spring Campaign – Window" and "Spring Campaign – Brochure" turn the list into a report.
- Note the start date. If you know the day the print run went out or the poster went up, you can interpret the rise in the chart correctly.
- Create comparable conditions. Comparing one code printed large at the entrance with another printed small in a corner measures the effect of the location, not the code. Interpret the results with that in mind.
- Act on the results. Change the location, size or call to action of a code that is never scanned, then measure again.
Which questions can scan data answer?
It is more productive to open the statistics screen with a specific question in mind rather than simply "how many scans do we have?":
- Is the campaign still attracting interest? Compare the last 7 days with the last 30 days. If weekly scans are falling, the material may be worn out, its location may have changed or the campaign may have run its natural course.
- On which days should I plan staff and content? The breakdown by weekday shows the busy days. For example, if a menu code is scanned heavily at weekends, it is important to keep the page it opens up to date for those days.
- Which screen should the landing page be designed for? QR codes are mostly scanned with phones, but if the link is also shared by email you may see desktop opens too. The device breakdown tells you which screen the page needs to look perfect on.
- Which material should I reprint? The list of most scanned codes helps you direct your budget to the material that performs best.
Reporting rhythm
Checking statistics every day is usually unnecessary. At the start of a campaign, check for the first few days to confirm the code really works; after that, a weekly review is enough. At the end of the month, compare codes and decide which materials to continue with.
Example reading: a trade show stand
Say that at a trade show you put separate codes on a roll-up banner at the stand, a table tent on the counter and the brochures. Throughout the show, the daily chart shows which days were busiest, and the "most scanned codes" list shows which material attracted the most interest. If the roll-up code was rarely scanned, perhaps it was too small to read from a distance; you can test this at the next event by enlarging it. For size recommendations, see our QR code print size guide, and for planning your event setup, our guide to digital business cards at events.
This kind of reading should not be used to draw firm conclusions from a single event, but to decide what to try at the next one. When you repeat the same comparison over several events, it becomes much clearer which material, size and call to action work for your audience. That cumulative learning is where the real value of measurement lies.
A note on privacy
Dynamic QR measurement relies on technical data such as the time of the scan, the IP address and browser information. The name or contact details of the person scanning are not obtained during the scan. However, under regulations such as the GDPR, an IP address can count as personal data in certain circumstances; limit who can access this data and mention QR measurement in your privacy notice. When you combine it with a form or survey that collects personal data, don't forget to add privacy notices that comply with the applicable legislation. This is general information, not legal advice.
Scan analytics in EcoQrCard
EcoQrCard has two separate statistics screens: one for general-purpose codes created in the QR Generator and one for employees' QR business cards. Both record the same data: scan time, IP address and browser information. Location data (country, city) is neither stored nor shown.
QR Generator codes
Scans of dynamic codes you create in the EcoQrCard QR Generator are recorded automatically. A scan means the code's landing page was opened once. On the QR Statistics screen you can see:
- Total Scans, Last 30 days, Last 7 Days and Today counts; next to the total, the percentage change of the last 30 days compared with the previous 30 days
- A Scan Trend chart for the last 30 days
- Device Breakdown (mobile, tablet, desktop)
- Scans by Weekday
- Most Scanned QR Codes (top 10) and a Recent Scans list with code name, type, IP address and date
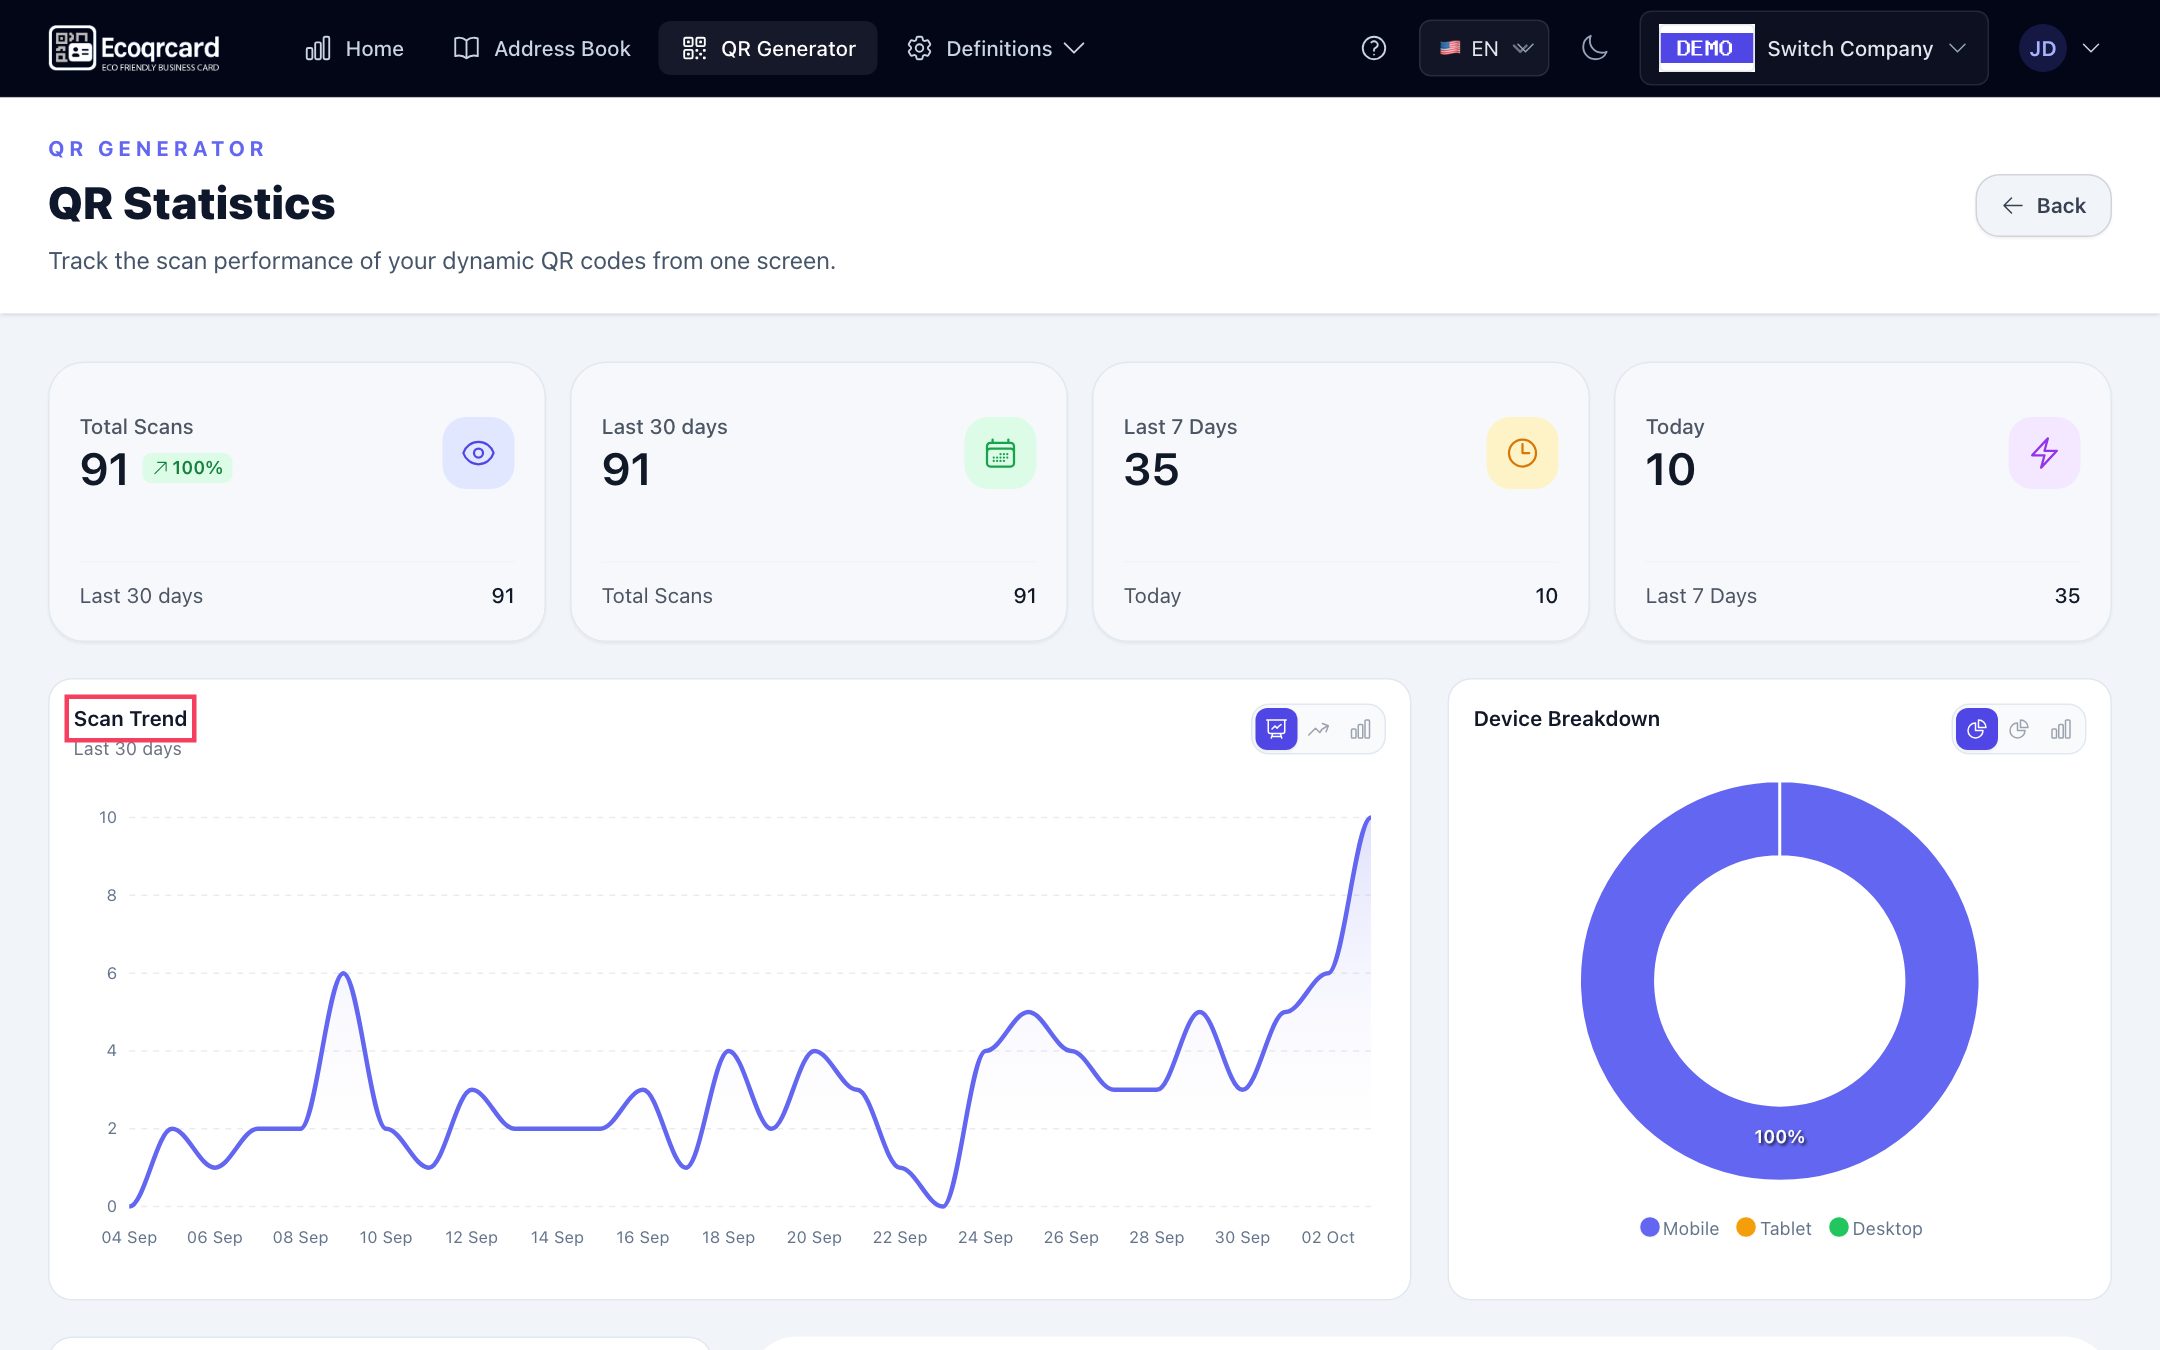
You can change the chart type (such as area, line, bar or donut). Previews opened from the panel with View are not counted, so your team's checks don't inflate the statistics. Dynamic codes in Draft status do not open when scanned and are not counted. The company administrator sees statistics for all codes; regular users see statistics for their own codes and for codes shared with the whole company. The saved codes list also shows each code's own scan count, so you can compare channels directly from the list.
Employee QR business cards
For business cards, administrators get a separate QR Statistics screen. In addition to the summary tiles and charts above, it includes a Scan Heatmap (Hourly) showing which hours of the day and which days of the week scans cluster around. The Most Scanned QR Cards list and a Recent Scans table with scan time, IP address and browser information are also here.
Every opening of the card page counts as one scan. A visitor pressing Add to Contacts on the same page is not added as a separate scan; a card opened from the preview on the employee's own Email Signature page, and an employee downloading their own card from their Home screen, are not counted either. A recipient of a signed email scanning the QR code, however, is counted as a normal scan. Employees see the total and this month's scan count for their own card on their Home screen. For details, take a look at our digital business card page.
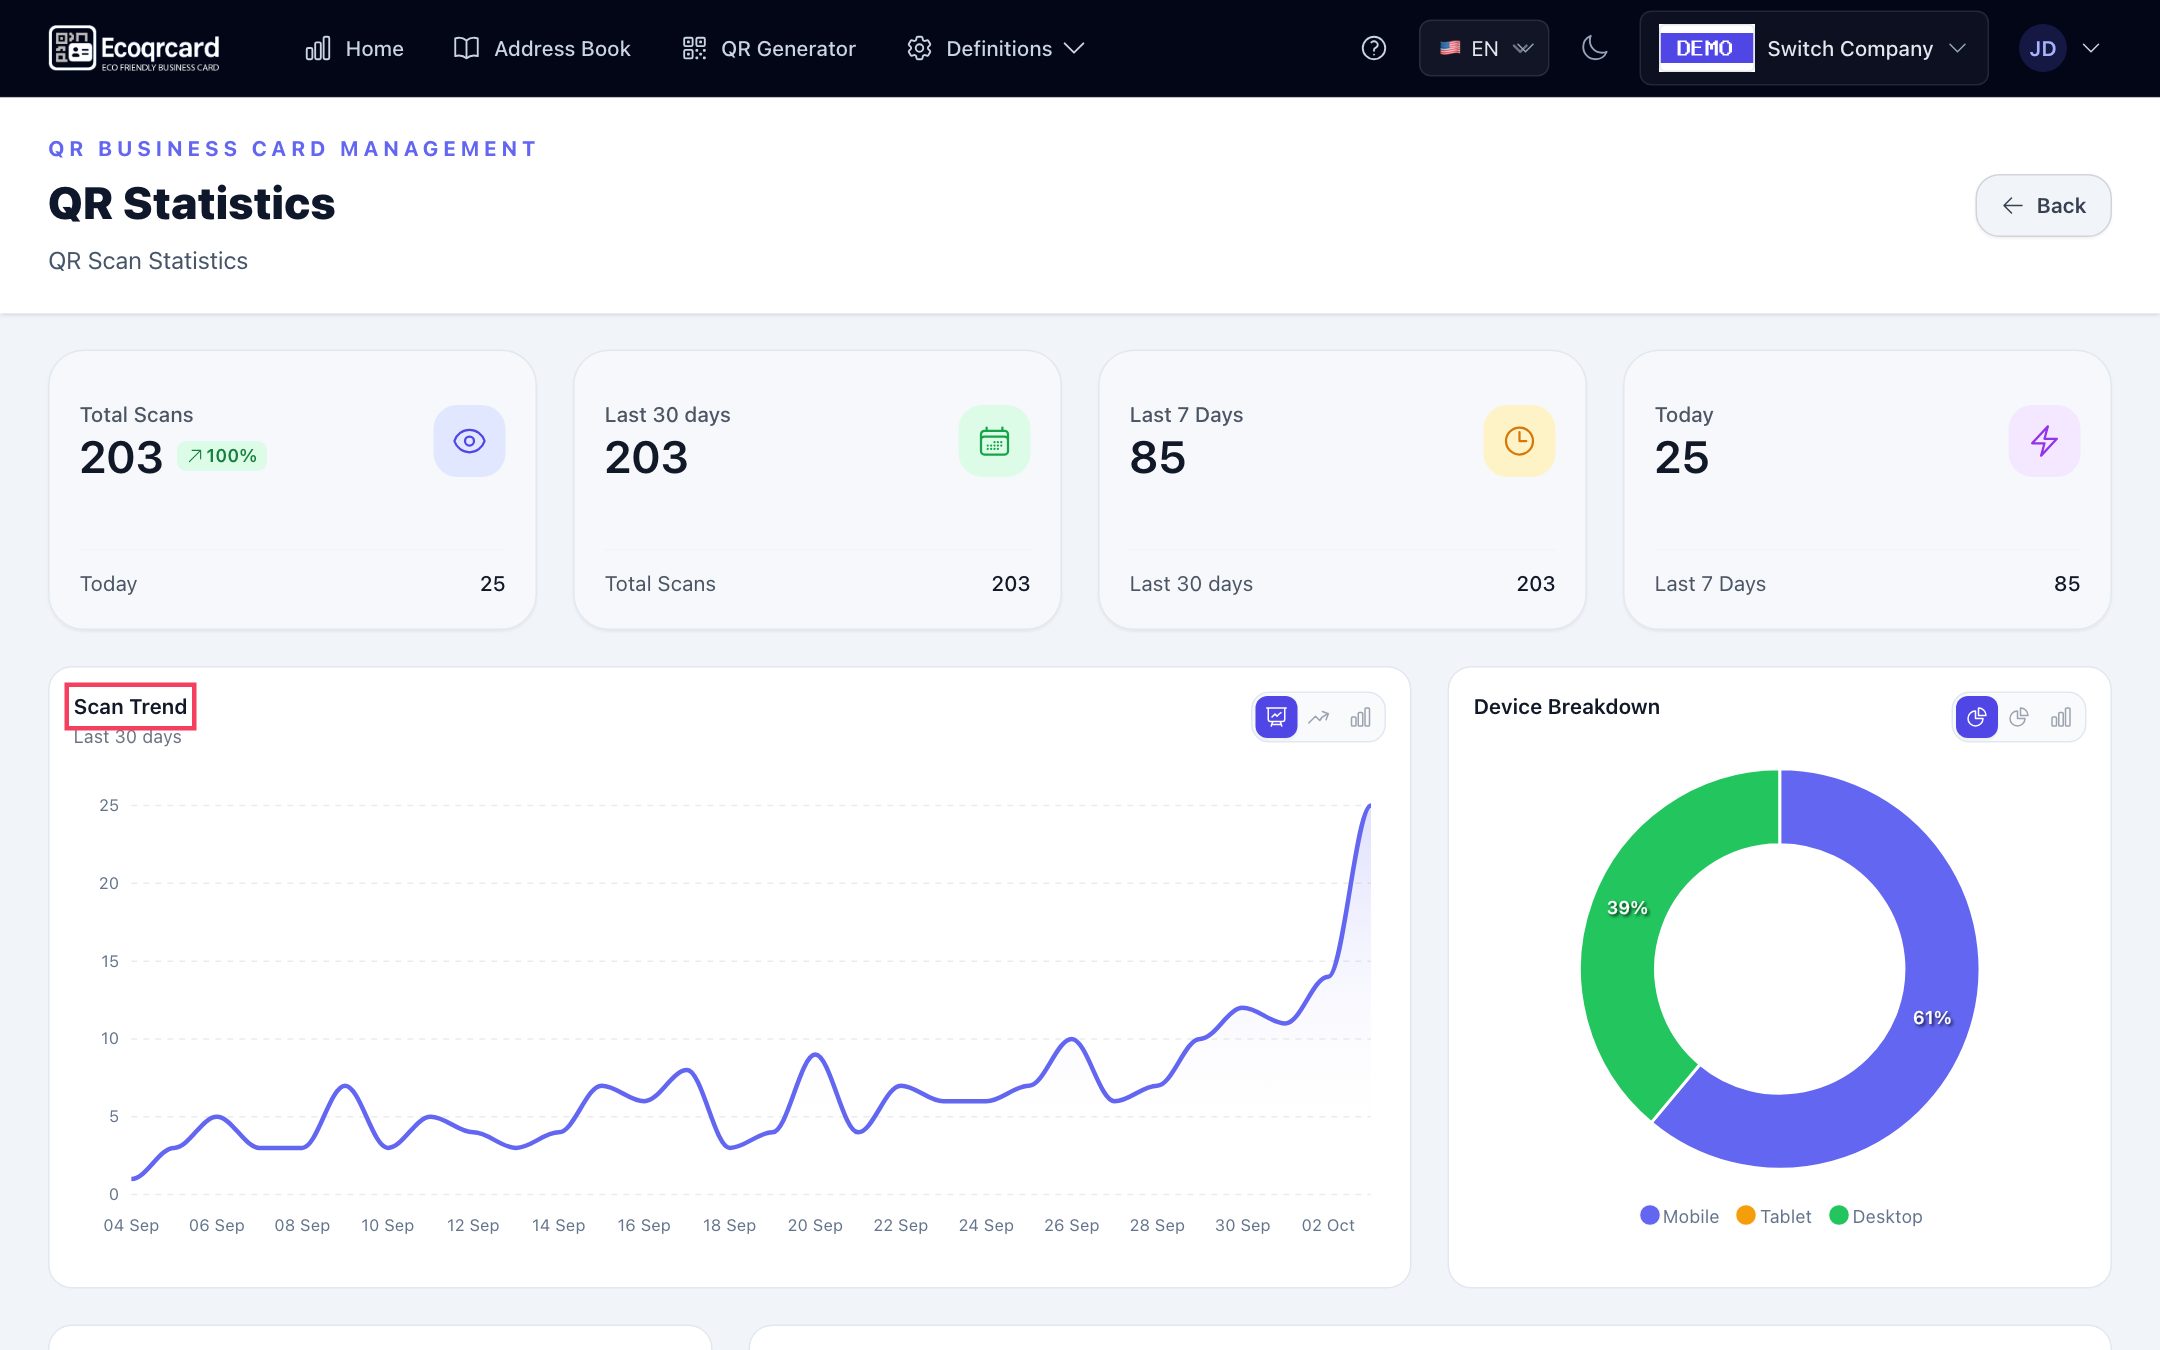
With this data you can see, for example, on which days the sales team's cards were opened most after a trade show, and what share of the cards were opened on a phone versus a desktop (for example, from a link forwarded by email).
If you also want to measure the opinion of the person scanning the code, you can link the QR code to a survey and analyse the responses with the survey system.
If you want to see from a single panel whether your printed materials and business cards are really being scanned, request a quote.
Frequently Asked Questions
Can I find out how many times a static QR code was scanned?
No. A static code opens the content directly, so the scan never passes through a server and cannot be counted. You need to create the codes you want to measure as dynamic codes.
Does the scan count show how many people scanned the code?
No, it shows the total number of scans. Multiple scans by the same person are counted separately. Treat the scan count as an indicator of the level of interest.
Can I see who scanned the QR code?
No. Scan data consists of technical information such as time, IP address and browser information; it does not include the person's name or contact details. If you want to know who they are, you need a form or survey on the page that opens, which people fill in voluntarily.
How do I know which campaign performed better?
Create a separate dynamic code for each channel, location or material and give the codes descriptive names. Then compare the results using the most scanned codes list and the daily chart.
Do my test scans distort the statistics?
Real scans with a phone are counted. "View" previews in the EcoQrCard panel are not. If you do your testing before the campaign starts, the effect stays small.