
Surveys
What Is NPS and How Is It Calculated? A Net Promoter Score Guide
What the Net Promoter Score measures, how it is calculated on a 0–10 scale, a worked example and the key points for setting up an NPS survey correctly.
Is it possible to express how much your customers like you in a single number? NPS, the Net Promoter Score, is a widely used metric designed for exactly that. It is based on a single question, is easy to calculate and lets you compare results over time. This guide explains what NPS is, how it is calculated, how to interpret the result and the most common mistakes.
What is NPS?
NPS is an indicator that measures how likely customers are to recommend a company, product or service to others. It was introduced by Fred Reichheld in his 2003 Harvard Business Review article "The One Number You Need to Grow" (developed together with Bain & Company and Satmetrix) and quickly became one of the most widely used metrics in many companies' customer experience measurement.
At the heart of NPS is a single question:
"How likely are you to recommend us to a friend or colleague?"
Respondents answer with a score from 0 to 10, where 0 means "not at all likely" and 10 means "extremely likely".
Three groups: promoters, passives and detractors
Based on their scores, respondents fall into three groups:
| Group | Score | Who are they? |
|---|---|---|
| Promoters | 9–10 | Loyal customers who happily recommend you |
| Passives | 7–8 | Satisfied but not enthusiastic; could easily switch to a competitor |
| Detractors | 0–6 | Dissatisfied customers who may share their negative experience |
The point to note is this: on an ordinary satisfaction scale, 7 and 8 might count as good, but in NPS these people are considered "passive" and do not add to the score. The NPS approach rests on the idea that real loyalty only shows itself with scores of 9 and 10.
How is NPS calculated?
The formula is simple:
NPS = % of promoters − % of detractors
Passives don't appear directly in the calculation, but they are included in the total number of respondents, so they affect the percentages indirectly. The result is expressed without a percent sign, as a number between −100 and +100.
Worked example
The figures below are purely illustrative.
Suppose 200 people responded to a company's NPS survey:
| Group | Number of people | Share |
|---|---|---|
| Promoters (9–10) | 110 | 55% |
| Passives (7–8) | 50 | 25% |
| Detractors (0–6) | 40 | 20% |
| Total | 200 | 100% |
NPS = 55 − 20 = 35
In this example, the company's NPS is 35. If the same company raises its share of promoters to 60% and reduces its share of detractors to 15% in the next quarter, its NPS rises to 45.
How do you interpret an NPS result?
- A positive score shows that you have more promoters than detractors.
- A negative score indicates that dissatisfied customers outnumber those who recommend you.
- There is no fixed threshold for a good NPS: it varies by industry, country, customer type and measurement method. The most meaningful comparison is how your own score changes over time.
The trend across regular measurements is more valuable than any single measurement. If the score is falling, look at the answers to the follow-up question to understand why.
Relationship NPS and transactional NPS
NPS is used for two different purposes:
| Type | What does it measure? | When is it asked? |
|---|---|---|
| Relationship NPS | The customer's overall relationship with the company | At set intervals, for example once a quarter or every six months |
| Transactional NPS | A specific experience (purchase, delivery, support request) | Shortly after the experience |
Relationship NPS appears in management reports as a strategic indicator, while transactional NPS helps you find problems in processes quickly. It's important not to mix the two and to report them separately; otherwise it becomes hard to understand why scores change.
What should you do with detractors?
Customers in the detractor group are the most valuable part of the NPS process. If you use an identified survey, getting back to low scorers quickly, solving the problem and sharing the outcome gives you a chance to win the customer back and shows that the process is sincere. Make these follow-ups a team member's responsibility and track them.
The follow-up question: the "why" behind the score
NPS on its own tells you what is happening but not why. That's why adding an open-ended follow-up question straight after the main question is so important. For example:
- "What is the main reason for your score?"
- "What could we have done differently to earn a higher score?"
- For promoters: "What do you like most?"
- For detractors: "Could you briefly describe the problem you experienced?"
Reading the follow-up answers separately for each group makes it clear what promoters love and why detractors are unhappy.
Steps to set up an NPS survey
- Decide what you are measuring: The company as a whole, a specific product, or a service experience?
- Choose the timing: Relationship NPS is asked at set intervals (for example once a quarter); transactional NPS is asked right after a purchase or support request.
- Keep the survey short: The main question, one follow-up question and, if needed, one or two extra questions are enough.
- Choose the distribution channel: Email invitation, a QR code in-store or on delivery, a link on your website.
- Share the results and act: Share the score with the relevant teams and get back to detractors.
Common mistakes
- Changing the scale: Using a 1–5 or 1–10 scale and reporting it as NPS; the results can no longer be compared with standard NPS.
- Skipping the follow-up question: You get a score, but it's unclear what to do about it.
- Asking only happy customers: The sample is skewed and the score doesn't reflect reality.
- Making decisions on too few responses: With few responses, the score swings widely.
- Turning the score into a target and steering responses: Phrases like "Please give us a 10" make the measurement meaningless.
- Not following up: Never getting back to a customer who shared a complaint makes the experience even worse.
NPS surveys with EcoQrCard
With EcoQrCard's survey system you can prepare your NPS survey in a few minutes. Two important details: EcoQrCard does not calculate the NPS score automatically; it shows the score distribution in charts, and you calculate the score from that distribution. Also, in the Rating question type the lowest value can be 1 and the highest 10, so you cannot build an 11-point scale with a 0 option using this type. To build the standard 0–10 scale exactly, we recommend the following method:
- Create a survey with New Survey (or start from one of the ready-made templates and edit it).
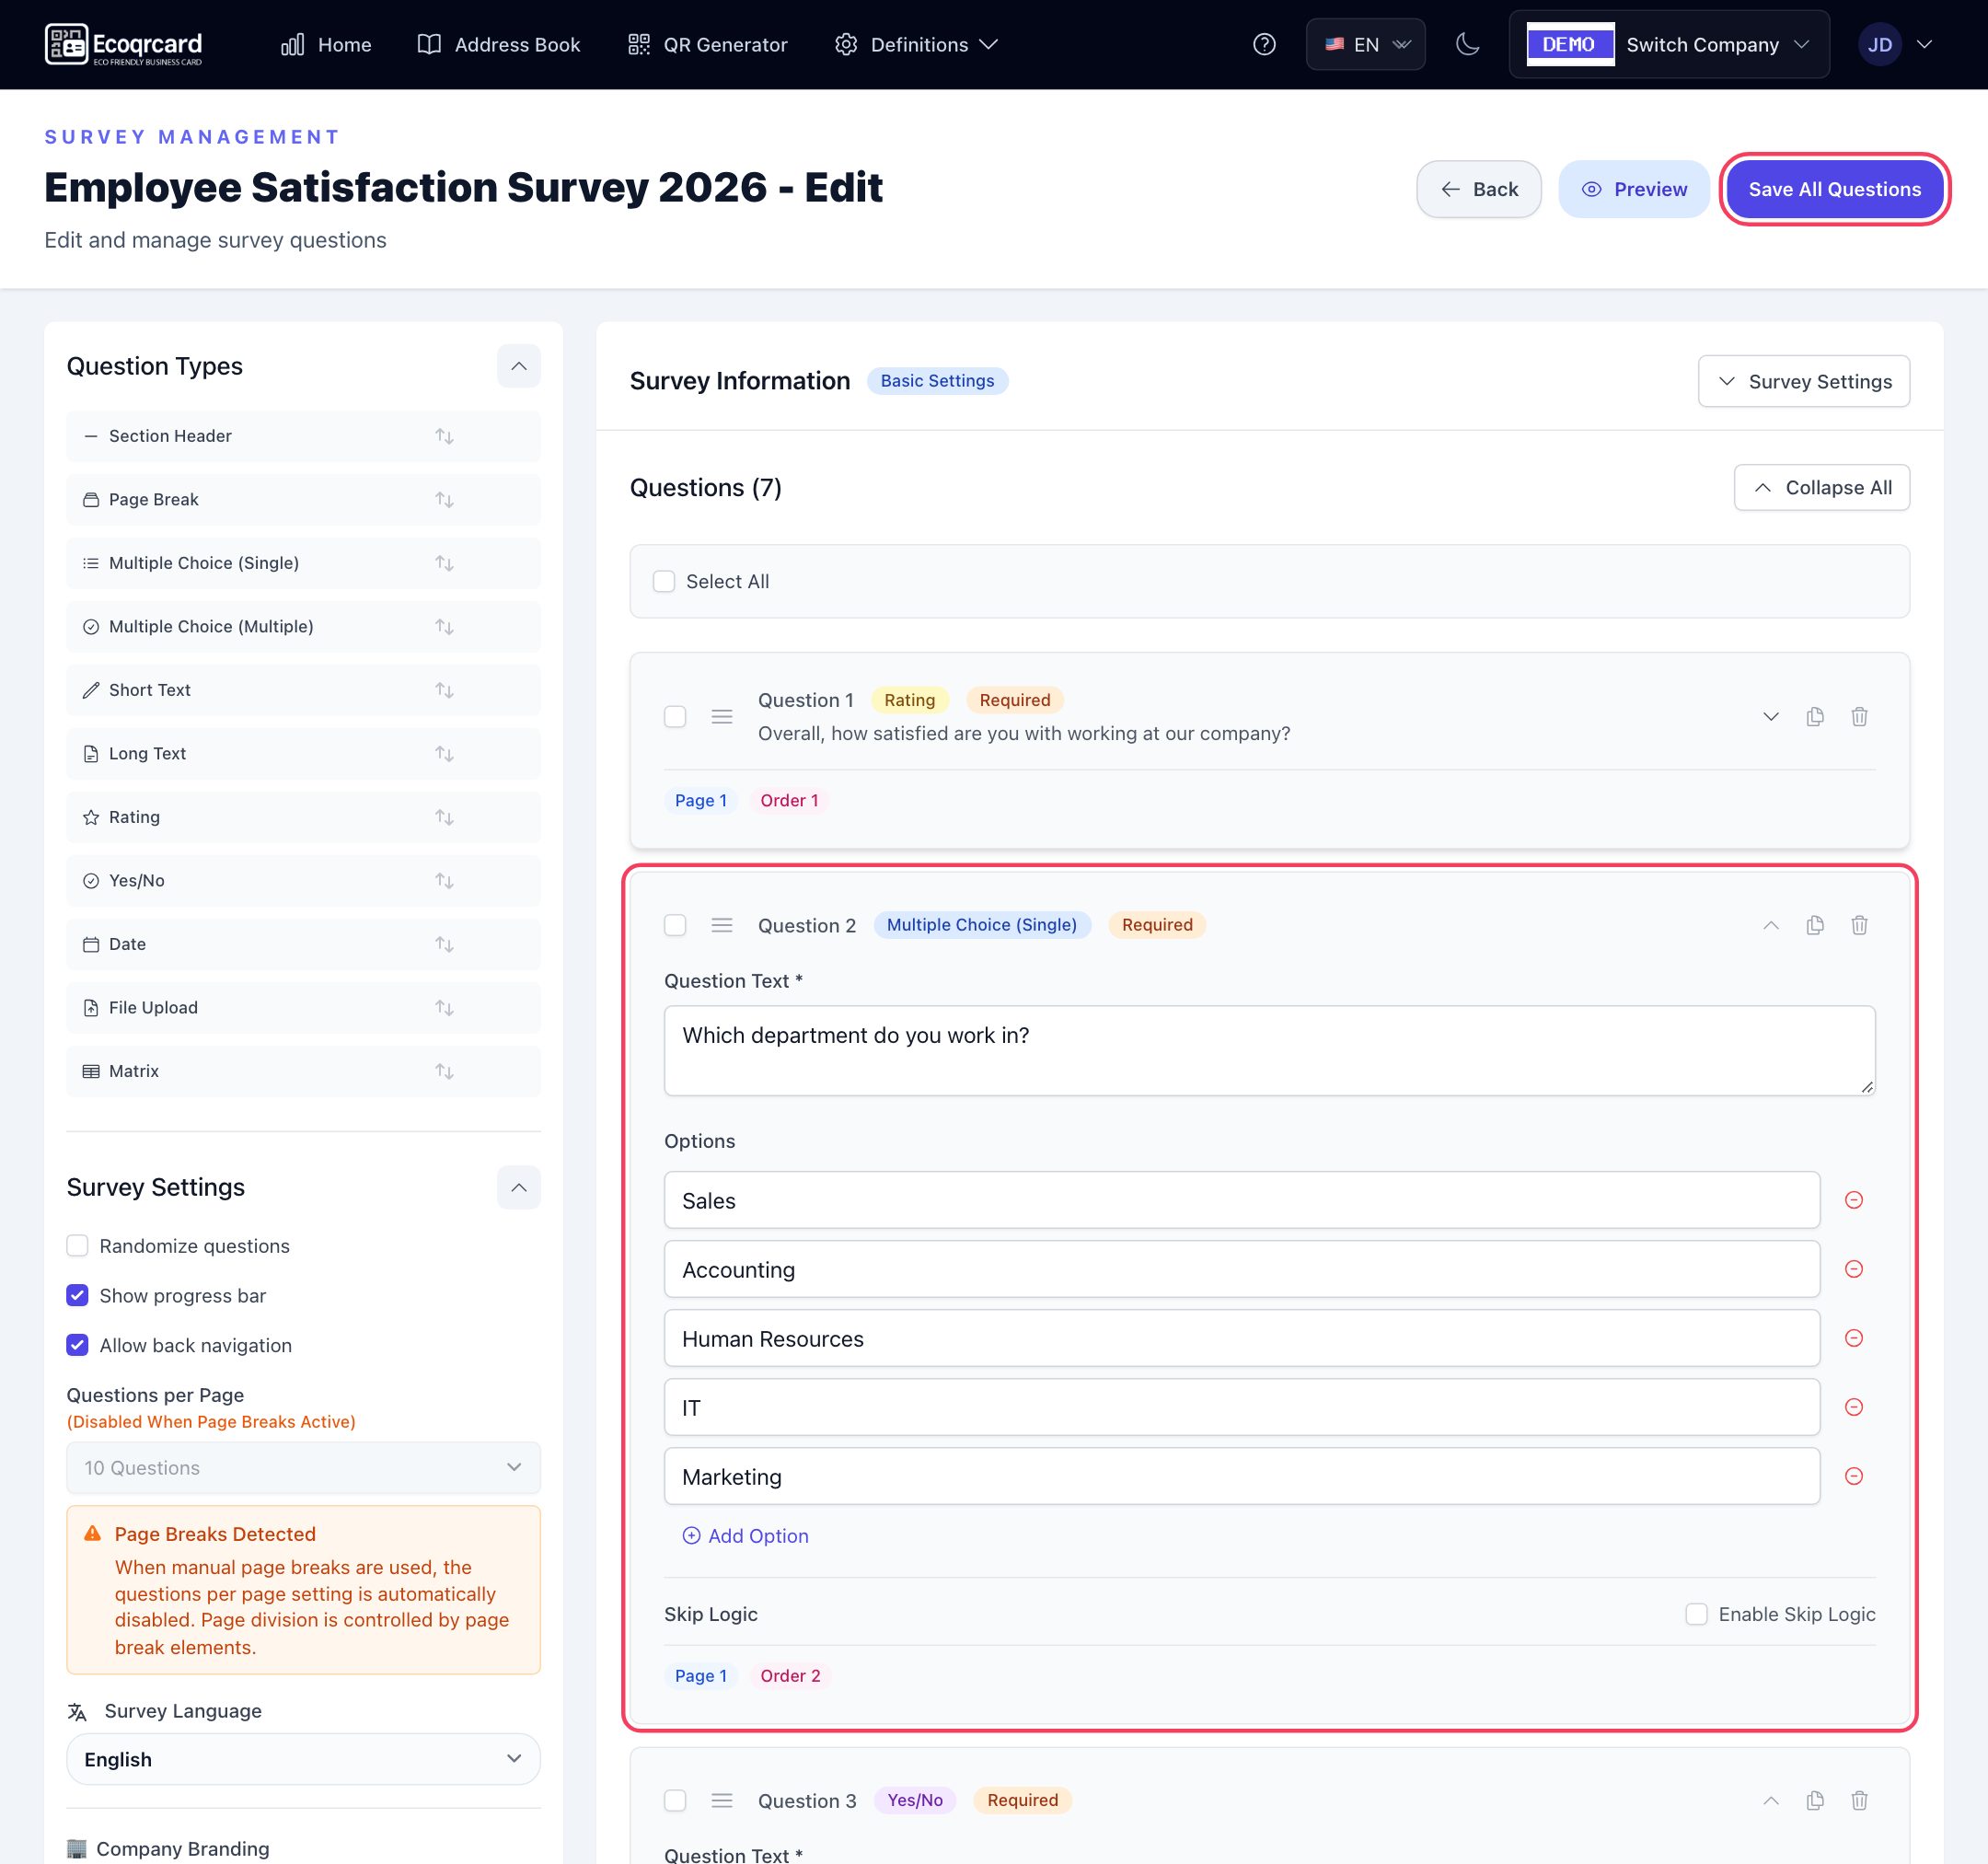
- Add a question of type Multiple Choice (Single) and use Add Option to define 11 options from 0 to 10. Enter the options in order: 0, 1, 2 … 10; you can add labels to the first and last options, such as "0 – Not at all likely" and "10 – Extremely likely".
- Make the question Required by clicking the Optional badge on its card.
- Directly below it, add a non-required follow-up question of type Long Text.
- Press Save All Questions, check it on a phone with Preview and set the Status to Active in the survey details.
- Publish the survey as anonymous or identified. In an identified survey, participants enter their email address before they start, so you can get back to detractors.
You can distribute the survey via a link, QR code or email invitations. For a shop, a delivery point or an event area, you can download and print the QR code, or create a branded code of the survey type in the QR Generator that points to your survey link. Email invitations are sent from your company's own mail server, which requires the company administrator to have configured the SMTP settings. You can import the participant list via Excel. Remember that in identified surveys, if you have added people to the distribution list, only the email addresses on the list can take part; bear this in mind if you also plan to collect responses via a public QR code in-store.
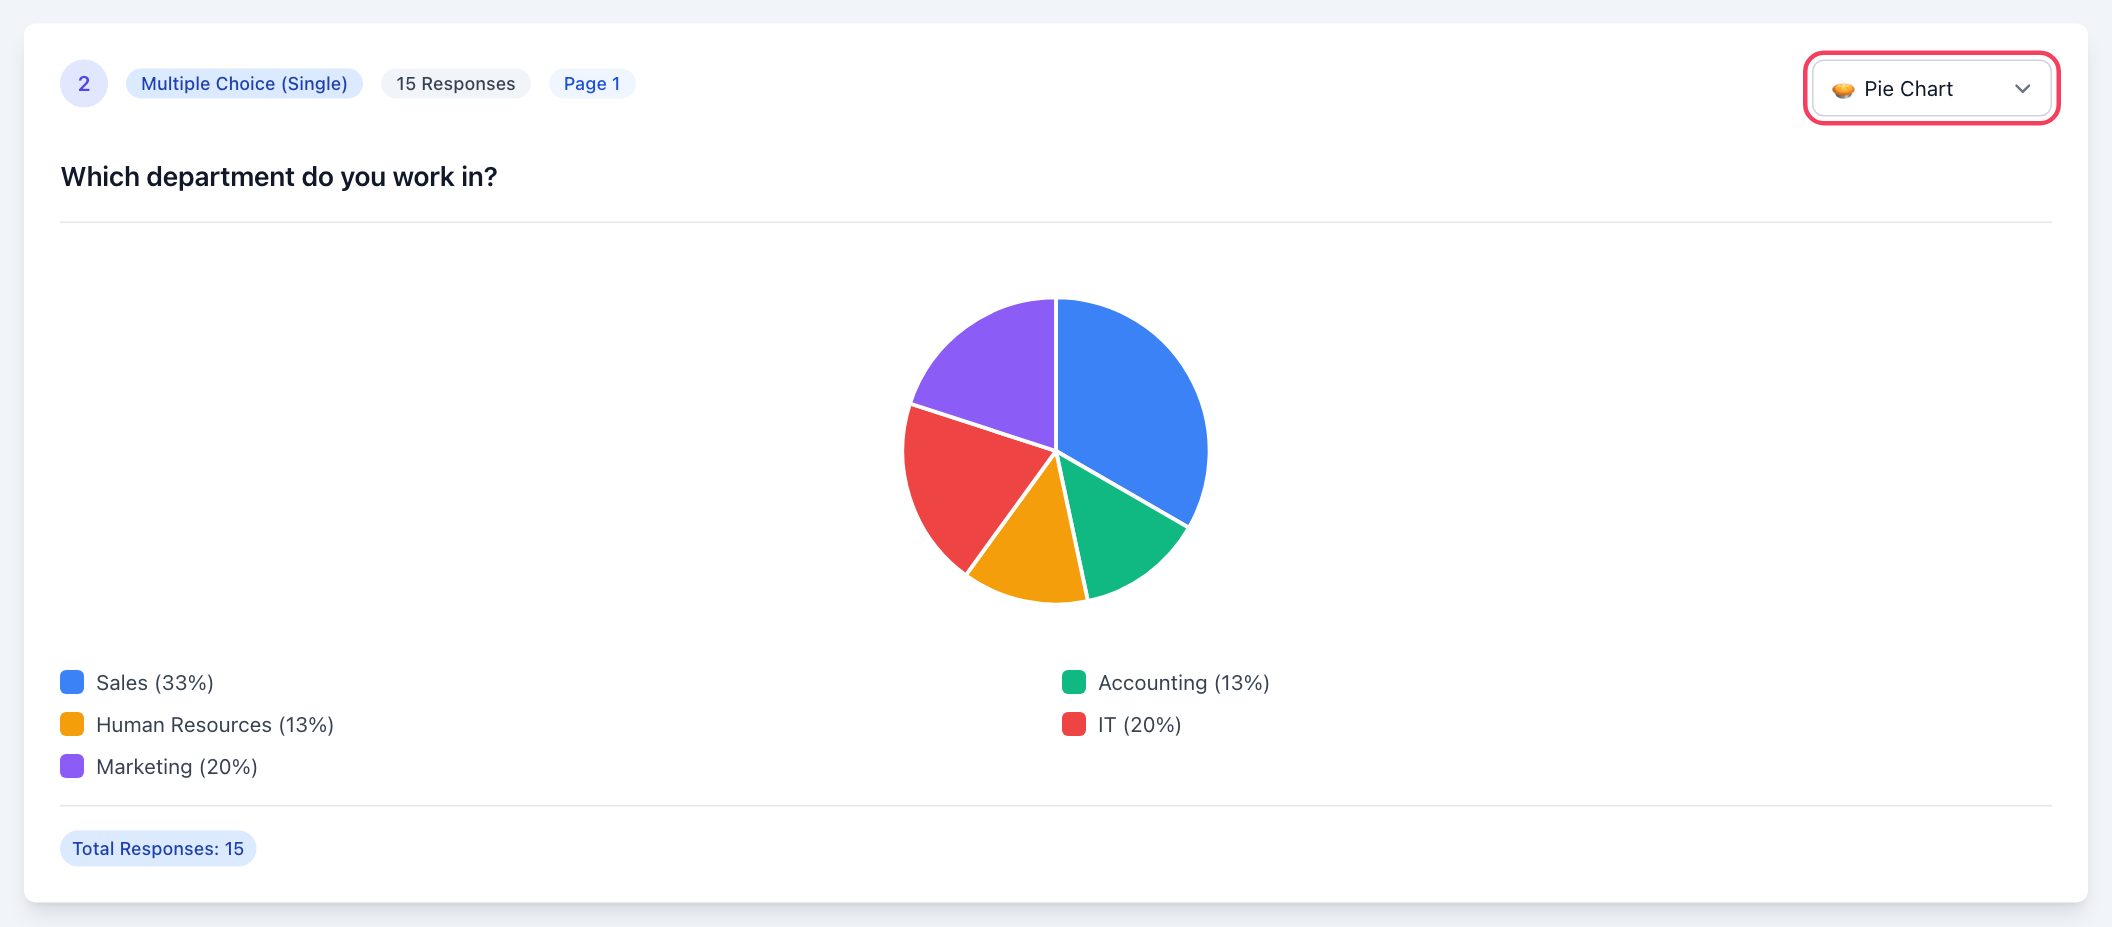
On the results screen you can see how many people chose each of the 0–10 options, in a view such as a bar chart. You calculate NPS by adding up 9 and 10 as promoters and 0–6 as detractors and applying the formula: for example, if the shares of 9 and 10 add up to 55% and the shares of 0–6 add up to 20%, the NPS is 35. You can review follow-up answers as a text list, a word cloud or an approximate sentiment analysis, and open individual responses one by one. To share results with your managers, you can generate a printable report and save it as a PDF; exporting results to Excel is not currently available.
For other ways to measure customer satisfaction, see our guide on how to create a customer satisfaction survey; for a similar approach on the employee side, see our employee engagement survey guide.
To turn NPS measurement into a regular process, fill in the quote request form and we will set up your survey infrastructure together.
Frequently Asked Questions
Why does NPS use a 0–10 scale?
The NPS group definitions (9–10 promoters, 7–8 passives, 0–6 detractors) are based on the 11-point 0–10 scale. If you use a different scale, the result can't be compared with standard NPS.
What is a good NPS?
There is no universal threshold. A positive score shows that promoters outnumber detractors, but expectations vary by industry and customer type. The most meaningful comparison is how your own score changes over time.
How often should I run an NPS survey?
Regular measurements once a quarter or every six months are common for measuring the overall relationship. To measure a specific experience, you can send the survey shortly after a purchase, delivery or support request. Avoid asking the same person too often.
Does EcoQrCard calculate NPS automatically?
No. EcoQrCard shows the distribution of responses in charts; you calculate NPS from that distribution by subtracting the percentage of detractors from the percentage of promoters. For the 0–10 scale, we recommend adding 11 options to a Multiple Choice (Single) question.
What is the difference between NPS and customer satisfaction (CSAT)?
Customer satisfaction questions usually ask how satisfied someone was with a specific experience. NPS measures the likelihood of recommending, which is a more general tendency towards loyalty. The two complement each other, and many companies use both.